
XRP price failed to break above the $0.5850 resistance zone. The price fell and is now showing some bearish signals below the $0.5750 level.
- XRP price is struggling to break above the $0.5850 level.
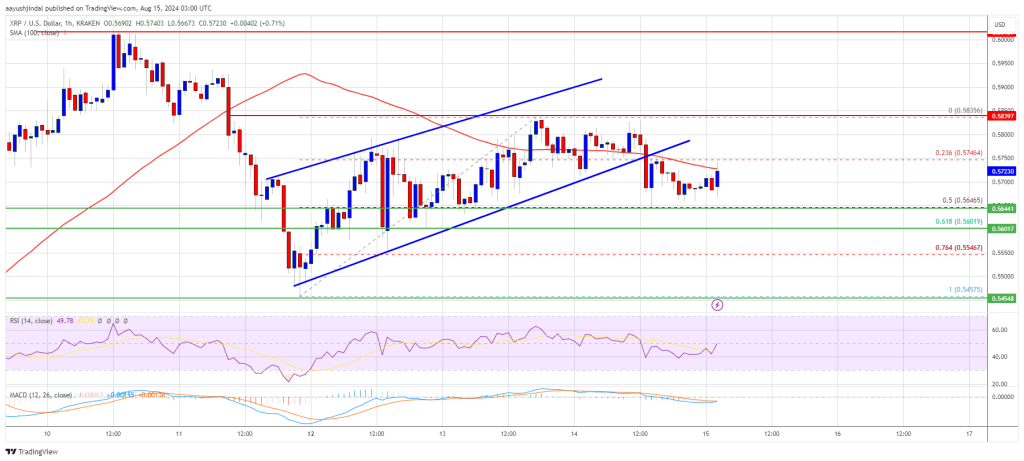
- The price is now trading below $0.5750 and the 100 hourly simple moving average.
- There was a break below a key ascending channel with support at $0.5745 on the hourly chart of the XRP/USD pair (data feed from Kraken).
- The pair could start a fresh increase if it breaks the resistance zone of $0.580.
XRP Price Drops to Support
XRP price remained stable near the $0.5650 level and attempted to gain more gains. However, it failed to clear the $0.5850 resistance and started another decline as Bitcoin and Ethereum.
There was a move below the $0.580 and $0.5750 levels. The price dropped below the 23.6% Fib retracement level of the upward move from the $0.5457 low to $0.5835 high. Moreover, there was a break below a key ascending channel with support at $0.5745 on the hourly chart of the XRP/USD pair.
The price is now trading below $0.5750 and the 100 hourly simple moving average. It is holding at the 50% Fibonacci retracement level of the upward move from the $0.5457 low to $0.5835 high.
On the upside, the price is facing hurdles near the $0.5750 level. The first major resistance is near the $0.580 level. The next key resistance could be $0.5850. A clear move above the $0.5850 resistance could send the price towards the $0.60 resistance. The next major resistance is near the $0.6150 level. Any further gains could send the price towards the $0.6250 resistance or even $0.6320 in the near term.
More losses?
If XRP fails to clear the $0.580 resistance zone, it could start another decline. The initial support on the downside lies near the $0.5650 level. The next major support lies at $0.560.
If there is a downside break and close below the $0.5600 level, the price could continue to decline towards the $0.550 support in the near term. The next major support lies at $0.5350.
Technical indicators
Hourly MACD – The MACD for XRP/USD is now losing momentum in the bullish zone.
Hourly RSI (Relative Strength Index) – The RSI for XRP/USD is now below the 50 level.
Major Support Levels: $0.5600 and $0.5550.
Main resistance levels: $0.5800 and $0.5850.
Disclaimer:
The information contained in this post is for general information purposes only. We make no representations or warranties of any kind, express or implied, about the completeness, accuracy, reliability, suitability or availability with respect to the website or the information, products, services, or related graphics contained on the post for any purpose.
We respect the intellectual property rights of content creators. If you are the owner of any material featured on our website and have concerns about its use, please contact us. We are committed to addressing any copyright issues promptly and will remove any material within 2 days of receiving a request from the rightful owner.