
On-chain data shows that Bitcoin has been moving to Coinbase from other exchanges. Here’s what this has historically meant for the asset.
Bitcoin Coinbase Flow Pulse Has Turned Green Recently
As CryptoQuant author Axel Adler Jr. explained in a new article mail in X, Coinbase Recently, inflows from other exchanges have resumed. The relevant indicator here is the “Coinbase Flow Pulse”, which records the net amount of Bitcoin flowing between Coinbase and the other cryptocurrency exchanges.
Below is the chart shared by the analyst showing the trend in the 7-day moving average (MA) of this indicator over the past few years.
Looks like the value of the metric has been heading up in recent days | Source: @AxelAdlerJr on X
As seen in the chart, the Bitcoin Coinbase Flow Pulse has been positive since mid-2023, meaning that Coinbase has been receiving net inflows from the other centralized exchanges.
However, the indicator’s trend above its 90-day MA is more relevant, as shown in the same chart. The analyst has defined two zones for BTC based on where the 7-day MA is compared to this long-term MA.
When the 7-day moving average crosses below the 90-day moving average, BTC is likely to be in a bearish trend, so periods like this are classified as a “bear market or correction” (highlighted in red). Similarly, the metric above this line implies a “bull market” (green).
It is clear from the chart that the 7-day MA of Coinbase Flow Pulse had dipped below the 90-day MA just before, but now, both have crossed again, implying that the demand for transferring coins to Coinbase has picked up.
The last time this pattern formed for the cryptocurrency was just before the rally towards the new all-time high (ATH). Therefore, this signal may also be bullish for the price this time.
As to why Coinbase may be relevant in this way for the asset, the answer may lie in the fact that the platform is a known destination for US institutional entities. As such, an influx of coins from other exchanges into Coinbase could imply demand from these US-based whales.
While the market outlook looks positive from the perspective of Coinbase Flow Pulse, another indicator from on-chain analytics firm CryptoQuant may not be as bright.
As Julio Moreno, director of research at CryptoQuant, explained in an article by X mailDemand for Bitcoin is still moderate when we consider the “Apparent Demand” metric, which seeks to estimate the demand present in the entire market and not just in one section of it, such as Coinbase Flow Pulse.
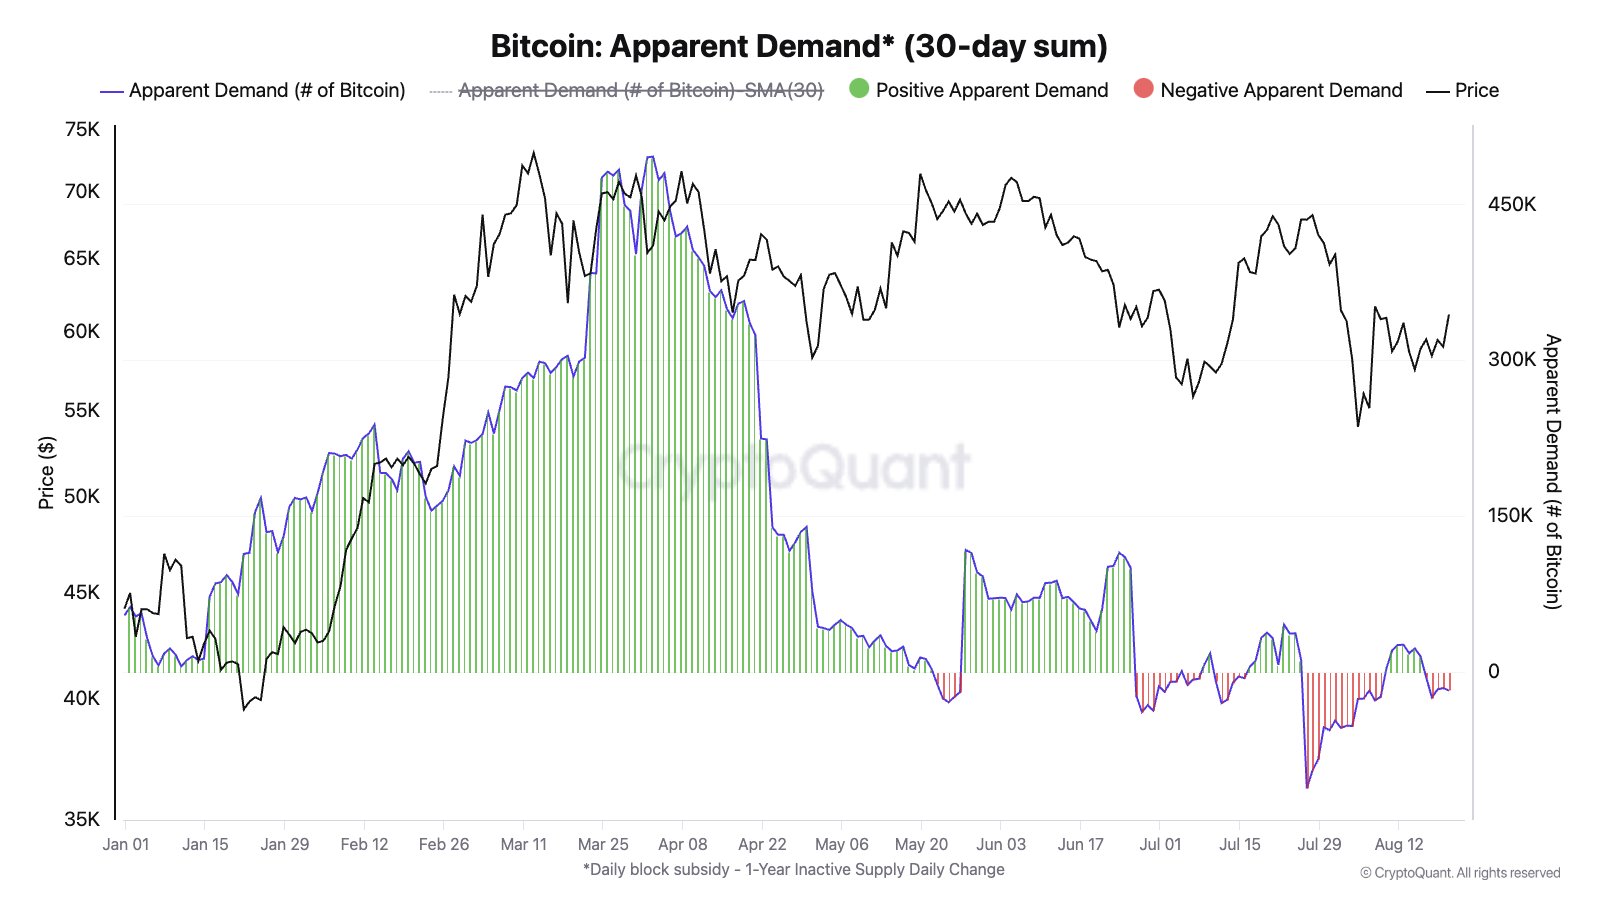
The value of the metric appears to have been neutral recently | Source: @jjcmoreno on X
While demand for Bitcoin was at significant levels at the beginning of the year, it appears to have fallen dramatically after the long consolidation streak, as Apparent Demand is currently at more or less neutral values.
BTC Price
At the time of writing, Bitcoin is trading at around $61,000, up more than 5% in the past week.

The price of the coin seems to be slowly making its way up | Source: BTCUSD on TradingView
Featured image by Dall-E, CryptoQuant.com, chart by TradingView.com
Disclaimer:
The information contained in this post is for general information purposes only. We make no representations or warranties of any kind, express or implied, about the completeness, accuracy, reliability, suitability or availability with respect to the website or the information, products, services, or related graphics contained on the post for any purpose.
We respect the intellectual property rights of content creators. If you are the owner of any material featured on our website and have concerns about its use, please contact us. We are committed to addressing any copyright issues promptly and will remove any material within 2 days of receiving a request from the rightful owner.