
XRP price dropped towards the $0.5550 level before the bulls stepped in. The price is now consolidating and it could target a fresh increase above $0.580.
- XRP price started a consolidation phase after a drop towards the $0.5550 zone.
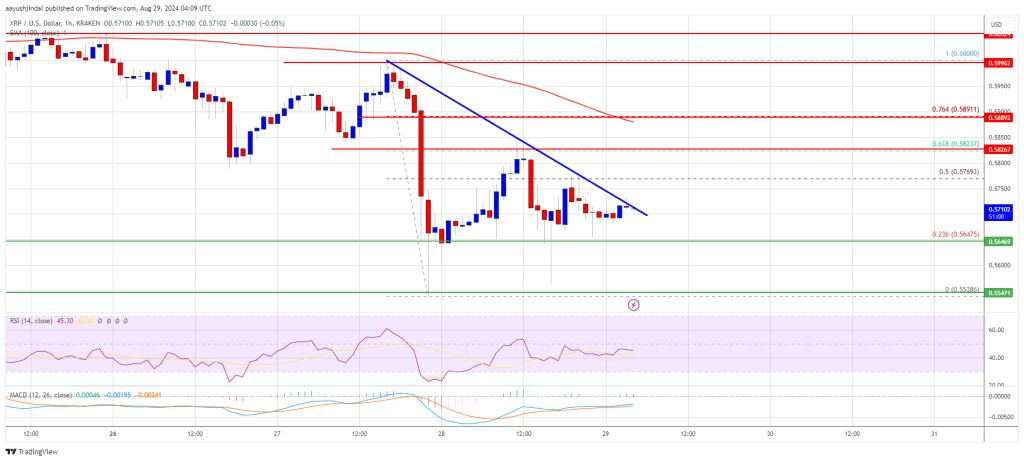
- The price is now trading below $0.580 and the 100 hourly simple moving average.
- There is a key bearish trend line forming with resistance at $0.5720 on the hourly chart of the XRP/USD pair (data feed from Kraken).
- The pair could attempt a recovery wave if it breaks the resistance zone of $0.580.
XRP price begins to consolidate
XRP price extended losses below the $0.580 level as Bitcoin and EthereumThe price even tested the $0.5550 zone. A low was formed at $0.5538 and the price recently started an upward correction.
There was a move above the $0.5580 and $0.5620 levels. The price spiked above the 50% Fibonacci retracement level of the downward move from the $0.60 high to $0.5538 low. However, the bears remained active and protected further upside above $0.5850.
The price is still trading below the $0.580 level and the 100 hourly simple moving average. On the upside, the price might find resistance near the $0.5720 level. There is also a key bearish trend line forming with resistance at $0.5720 on the hourly chart of the XRP/USD pair.
The first major resistance is located near the $0.5885 level. It is close to the 76.4% Fib retracement level of the downward move from the $0.60 high to $0.5538 low.
The next key resistance could be at $0.60. A clear move above the $0.60 resistance could send the price towards the $0.6050 resistance. The next major resistance is near the $0.6160 level. Any further gains could send the price towards the $0.6250 resistance or even $0.6320 in the near term.
Another decline?
If XRP fails to clear the $0.5720 resistance zone, it could start another decline. The initial support on the downside is near the $0.5640 level. The next major support is at $0.5550.
If there is a downside break and close below the $0.5550 level, the price could continue to decline towards the $0.5320 support in the near term. The next major support lies at $0.5120.
Technical indicators
Hourly MACD – The MACD for XRP/USD is now losing momentum in the bearish zone.
Hourly RSI (Relative Strength Index) – The RSI for XRP/USD is now below the 50 level.
Major Support Levels: $0.5640 and $0.5550.
Main resistance levels: $0.5720 and $0.5885.
Disclaimer:
The information contained in this post is for general information purposes only. We make no representations or warranties of any kind, express or implied, about the completeness, accuracy, reliability, suitability or availability with respect to the website or the information, products, services, or related graphics contained on the post for any purpose.
We respect the intellectual property rights of content creators. If you are the owner of any material featured on our website and have concerns about its use, please contact us. We are committed to addressing any copyright issues promptly and will remove any material within 2 days of receiving a request from the rightful owner.