
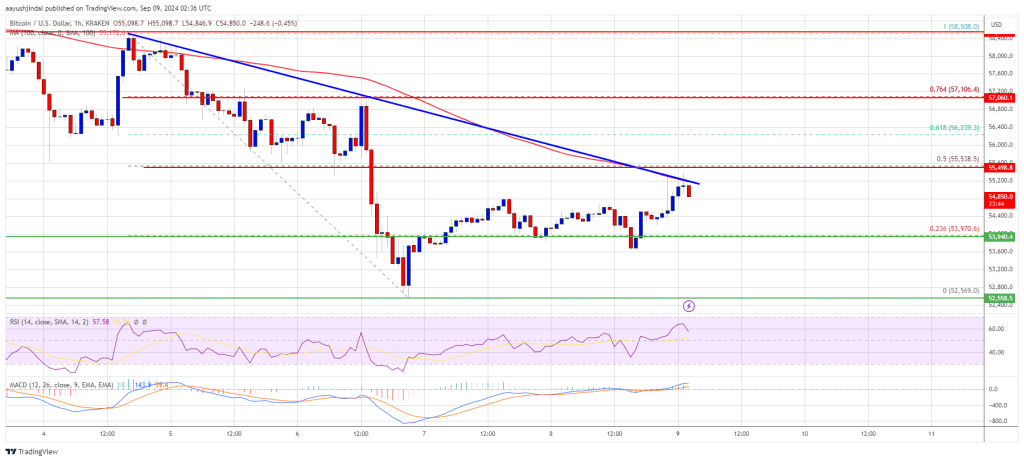
Bitcoin price held support near the $52,500 zone. BTC is recovering losses and facing hurdles near the $55,200 and $55,500 levels.
- Bitcoin is struggling to recover above the $55,500 zone.
- The price is trading below $55,200 and the 100 hourly simple moving average.
- There is a key bearish trend line forming with resistance at $55,200 on the hourly chart of the BTC/USD pair (data feed from Kraken).
- The pair might struggle to recover above the $55,500 or $56,000 resistance levels in the near term.
Bitcoin price points to recovery
The price of Bitcoin remained in a bearish zone and extended losses below the $55,500 support zone. BTC even fell below the $53,200 level. It tested the $52,500 zone. A low was formed at $52,569 and the price is now attempting a recovery wave.
There was a move above the $53,200 and $54,000 resistance levels. It surpassed the 23.6% Fib retracement level of the downward move from the $58,508 high to $52,569 low. However, the price is now struggling to recover above the $55,500 zone.
Bitcoin is now trading below $55,200 and the 100 hour simple moving averageOn the upside, the price might face resistance near the $55,200 level. There is also a key bearish trend line forming with resistance at $55,200 on the hourly chart of the BTC/USD pair.
The trend line is close to the 50% Fib retracement level of the downward move from the $58,508 high to $52,569 low. The first key resistance is near the $55,500 level. A clear move above the $55,500 resistance could push the price higher in the coming sessions.
The next key resistance could be at $56,200. A close above the $56,200 resistance could trigger further gains. In such a case, the price could rise and test the $57,500 resistance.
Another BTC crash?
If Bitcoin fails to break above the $55,500 resistance zone, it could start another decline. The immediate support on the downside lies near the $54,000 level.
The first major support is at $53,200. The next support is now near the $52,500 zone. Any further losses could send the price towards the $51,800 support in the near term.
Technical indicators:
Hourly MACD – The MACD is now losing momentum in the bullish zone.
Hourly RSI (Relative Strength Index) – The RSI for BTC/USD is now above the 50 level.
Major Support Levels: $54,000, followed by $53,200.
Major Resistance Levels: $55,200 and $55,500.
Disclaimer:
The information contained in this post is for general information purposes only. We make no representations or warranties of any kind, express or implied, about the completeness, accuracy, reliability, suitability or availability with respect to the website or the information, products, services, or related graphics contained on the post for any purpose.
We respect the intellectual property rights of content creators. If you are the owner of any material featured on our website and have concerns about its use, please contact us. We are committed to addressing any copyright issues promptly and will remove any material within 2 days of receiving a request from the rightful owner.