
XRP price is holding gains above the $0.5250 level. The price is now trading in a tight range and it might soon attempt to break above the $0.550 resistance.
- XRP price is targeting a clear move above the $0.5420 resistance zone.
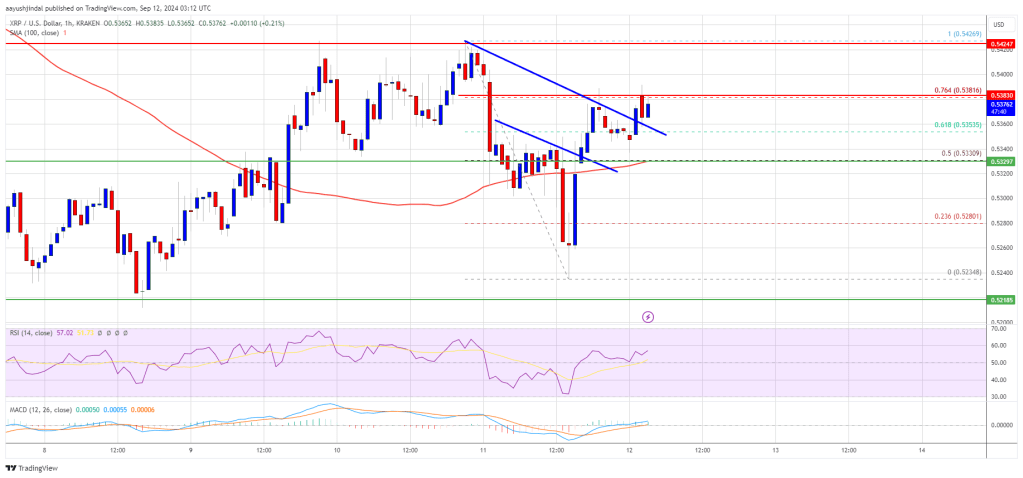
- The price is now trading above $0.5330 and the 100 hourly simple moving average.
- There was a break above a short-term bearish trend line with resistance at $0.5360 on the hourly chart of the XRP/USD pair (data feed from Kraken).
- The pair could gain bullish momentum if it clears the resistance levels of $0.5420 and $0.5450.
XRP Price Eyes Bullish Breakout
XRP price remained well supported above the $0.5220 level as Bitcoin and EthereumThe price started a fresh increase within the range and was able to overcome the resistance level of $0.5320.
The price rose above the 50% Fib retracement level of the downward move from the $0.5426 high to $0.5234 low. There was also a break above a short-term bearish trend line with resistance at $0.5360 on the hourly chart of the XRP/USD pair.
The price is now trading above $0.5330 and the 100 hourly simple moving average. On the upside, the price might face resistance near the $0.5380 level or the 76.4% Fib retracement level of the downward move from the $0.5426 high to $0.5234 low.
The first major resistance is near the $0.5420 level. The next key resistance could be at $0.5450. A clear move above the $0.5450 resistance could send the price towards the $0.5550 resistance.
The next major resistance is near the $0.5640 level. Any further gains could send the price towards the $0.5800 or even $0.5880 resistance in the near term.
Another decline?
If XRP fails to clear the $0.5420 resistance zone, it could start another decline. The initial support on the downside is near the $0.5330 level and the 100 hourly simple moving average (SMA). The next major support is $0.5280.
If there is a downside break and close below the $0.5280 level, the price could continue to decline towards the $0.5220 support in the near term. The next major support lies at $0.5150.
Technical indicators
Hourly MACD – The MACD for XRP/USD is now gaining momentum in the bullish zone.
Hourly RSI (Relative Strength Index) – The RSI for XRP/USD is now above the 50 level.
Major Support Levels: $0.5330 and $0.5280.
Main resistance levels: $0.5420 and $0.5450.
Disclaimer:
The information contained in this post is for general information purposes only. We make no representations or warranties of any kind, express or implied, about the completeness, accuracy, reliability, suitability or availability with respect to the website or the information, products, services, or related graphics contained on the post for any purpose.
We respect the intellectual property rights of content creators. If you are the owner of any material featured on our website and have concerns about its use, please contact us. We are committed to addressing any copyright issues promptly and will remove any material within 2 days of receiving a request from the rightful owner.