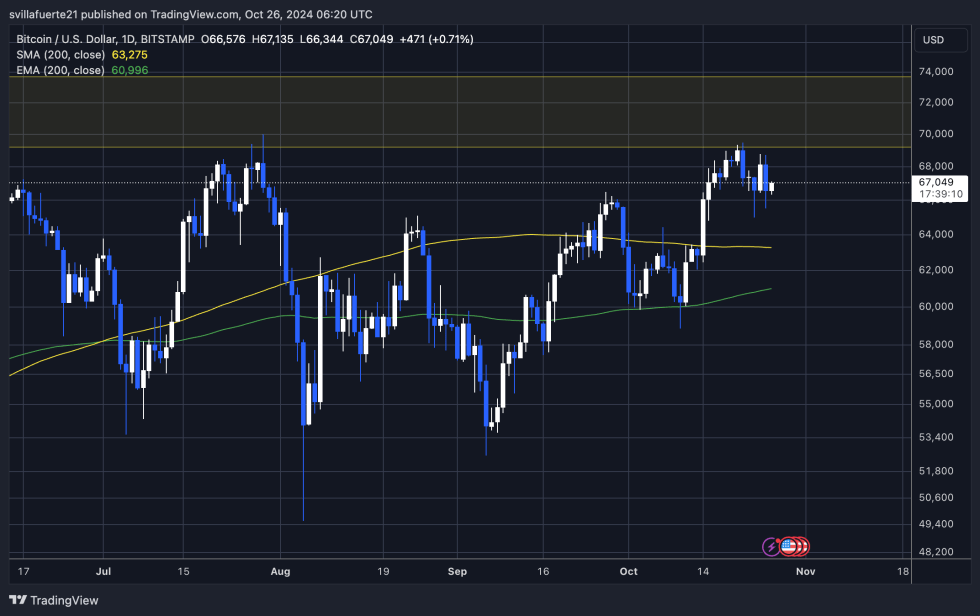
Bitcoin has faced a turbulent week, with price swings ranging from a local high of $69,500 to a low of $65,000, cooling after weeks of bullish enthusiasm. Now, BTC is consolidating just below the crucial $70,000 level, a price seen as a key threshold for the next big move.
Despite the cooling of prices, major investors and analysts are closely monitoring market dynamics. CryptoQuant analyst and prominent investor Maartunn recently shared a chart highlighting a significant increase in BlackRock’s balance and changes in BTC’s balance, suggesting that the financial giant may be strategically propping up the market.
This realization of BlackRock’s growing involvement has generated new optimism among investors, who see institutional support as a powerful foundation for Bitcoin’s potential rally. The company’s increased presence in the BTC market, as shown by Maartunn’s analysis, implies a deepening commitment that could bring greater stability and strength to BTC prices in the coming weeks.
As Bitcoin stabilizes below $70,000, these signals from big players like BlackRock add an extra layer of anticipation to the market, and analysts speculate their influence could push BTC through critical resistance levels.
Bitcoin growth sustained by institutions
Bitcoin is approaching a pivotal moment, and market sentiment strongly favors a push towards new all-time highs in the near future. Analysts and investors are increasingly optimistic as ETF flows have shown consistent positivity in recent weeks, reinforcing expectations for BTC’s upward trajectory. Price action has also been resilient, consolidating at near-critical resistance levels and signaling underlying market strength.
A recent analysis by prominent analyst Maartunn sheds light on an intriguing dynamic involving BlackRock’s BTC holdings. Maartunn shared a chart revealing BlackRock’s Bitcoin balance and its net balance changes, indicating that the financial giant may be subtly propping up the market.
The chart highlights a notable trend: the positive changes in BlackRock’s balance have overwhelmingly outweighed the negative ones, suggesting a sustained accumulation phase. This pattern implies that BlackRock may be positioning itself as a key BTC market maker, possibly providing liquidity and contributing to price stability in a highly volatile market.
Such actions by BlackRock could prove to be a major catalyst for the price of Bitcoin, as institutional participation historically fosters investor confidence and mitigates market declines. With positive ETF flows and strategic accumulation from major players like BlackRock, the current setup points towards an environment primed for an upside move. If BTC continues to maintain these levels and institutional support remains strong, the stage could be set for a rally that takes BTC into uncharted territory.
Bitcoin tests crucial liquidity
Bitcoin is currently trading at $67,000 and appears to be forming a bullish flag pattern, which could potentially drive the price higher in the near term. The price has successfully held above the critical $65,000 level, providing a solid foundation for a bullish outlook as it indicates strong buyer interest. This key threshold has acted as support, preventing further declines and reinforcing optimism among traders.

However, next week will be crucial for Bitcoin. If the price fails to break above the $70,000 mark, a pullback towards lower demand levels is likely. Such a move could test the 200-day moving average, currently situated at $63,275. If BTC were to fall below the $65,000 mark, this area would become a focal point for traders looking for strong demand as it has historically served as a significant support level.
Maintaining the bullish flag pattern and breaking through the $70,000 resistance will be vital to maintaining the bullish momentum. Traders will closely monitor the price action to determine if BTC can continue its rise or if a pullback to lower levels is on the horizon. The coming days will reveal whether the bullish sentiment can take BTC to new heights.
Featured image of Dall-E, TradingView chart
Disclaimer:
The information contained in this post is for general information purposes only. We make no representations or warranties of any kind, express or implied, about the completeness, accuracy, reliability, suitability or availability with respect to the website or the information, products, services, or related graphics contained on the post for any purpose.
We respect the intellectual property rights of content creators. If you are the owner of any material featured on our website and have concerns about its use, please contact us. We are committed to addressing any copyright issues promptly and will remove any material within 2 days of receiving a request from the rightful owner.

