Market sentiment has shifted from bullish optimism, with investors actively buying on dips, to a more cautious and fearful approach, leading many to sell at any sign of recovery.
The emotional feelings of the market
The market’s response to news, whether positive or negative, is often marked by emotional reactions. For example, an increase in investor confidence can lead to rapid price increases, sometimes leading to overvaluations. Conversely, when prices begin to fall, fear can lead investors to liquidate their holdings to minimize losses.
While such emotional volatility can pose challenges, it can also present unique buying opportunities for those who carefully analyze market conditions.
In light of current uncertainties, investors are advised to consider technical indicators such as the “death cross”, a signal that typically indicates a transition from bullish to bearish market conditions.
Evaluation of the death cross and the golden cross
The death cross occurs when a short-term moving average falls below a long-term moving average, often represented by the 50-day moving average falling below the 200-day moving average. This technical formation often serves as a precursor to further market declines.
Conversely, the golden cross occurs when the 50-day moving average exceeds the 200-day moving average, indicating a bullish setup.
Also read: Is this the end of the bull market?
To contextualize the death cross and the golden cross within the current market environment, let’s explore the prevalence of this signal in various indices:
See full image
These figures indicate that while some stocks are showing bearish trends, a substantial number are still showing resistance and bullish trends even as markets are correcting. The presence of golden cross formations in other stocks underlines this potential for bullish momentum.
Readers should understand that the stock may trade below the 50DMA and 200DMA with the golden cross, which does not confirm the bearish reversal.
Also read: 3 companies that could pay big dividends
Market trends and setbacks
It is crucial to recognize that stock markets do not move in a straight line; They undergo fluctuations known as retracements, which offer opportunities in the general trend.
According to Dow theory, market movements can be segmented into primary trends that represent long-term direction and intermediate trends that reflect short-term fluctuations. Pullbacks often mean temporary reversals or consolidations, offering investors the opportunity to reevaluate their strategies.
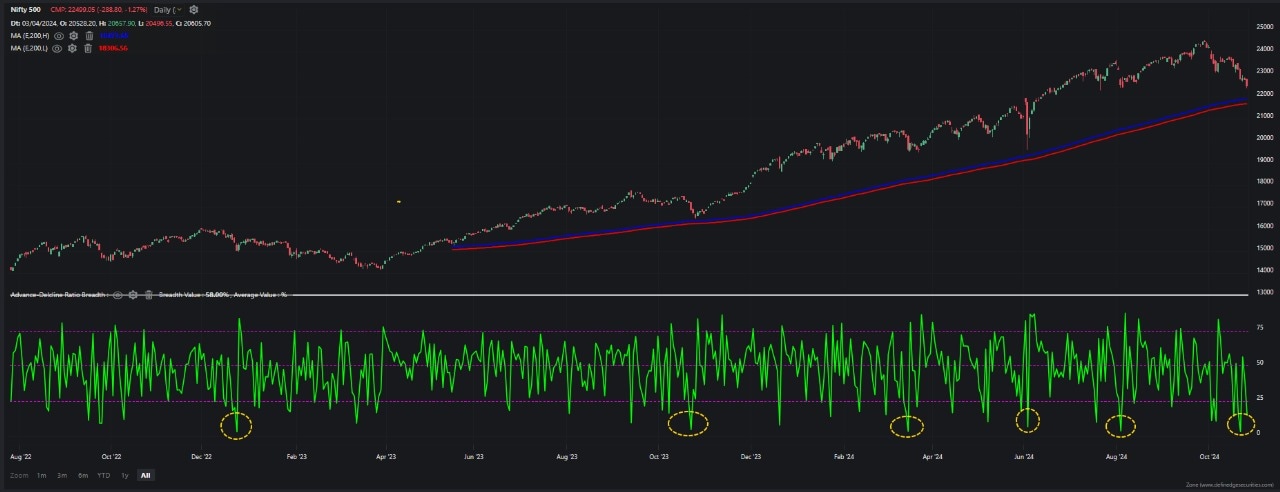
The Nifty500 chart reveals several intriguing setups that could influence the market sentiment.

See full image
The advance-decline ratio is currently in an oversold zone, which often indicates a possible reversal. The advance-decline line measures the balance between rising and falling stocks. Historical patterns indicate that when the AD line falls below 10, it may herald a momentum reversal, particularly for the Nifty500.
With the Nifty500 index remaining above its long-term 200-day exponential moving average (DEMA), the current price declines can be interpreted as typical market behavior rather than an immediate cause for concern. This positioning could encourage investors to view any slowdowns as potential buying opportunities.
For more such analysis, read Earnings pulse.
Maintaining a balanced perspective is key in the current market volatility, as fear influences emotions that can eventually lead to hasty decisions. However, it is important to recognize the potential long-term trend opportunities that these corrections can generate.
With the Nifty500 trading above its 200-day exponential moving average and the advance-decline line indicating oversold conditions, a potential market reversal may be on the horizon. However, the subsequent actions of foreign institutional investors will play a critical role in shaping future market dynamics. While a reversal could entice optimistic investors back into the fold, it is essential to proceed carefully as unbridled greed can lead to risky decisions.
Note: The purpose of this article is solely to share interesting graphs, data points, and thought-provoking opinions. It is NOT a recommendation. If you would like to consider an investment, we strongly recommend that you consult your advisor. This article is for strictly educational purposes only.
As per Sebi guidelines, the writer and his dependents may or may not own the stocks/commodities/crypto/any other assets discussed here. However, Definedge clients may or may not own these securities.
Brijesh Bhatia has over 18 years of experience in the Indian financial markets as a trader and technical analyst. He has worked with companies like UTI, Asit C Mehta and Edelweiss Securities. He is currently an analyst at Definedge.
Disclosure: The writer and his dependents do not own the shares discussed here. However, Definedge clients may or may not own these securities.
Disclaimer:
The information contained in this post is for general information purposes only. We make no representations or warranties of any kind, express or implied, about the completeness, accuracy, reliability, suitability or availability with respect to the website or the information, products, services, or related graphics contained on the post for any purpose.
We respect the intellectual property rights of content creators. If you are the owner of any material featured on our website and have concerns about its use, please contact us. We are committed to addressing any copyright issues promptly and will remove any material within 2 days of receiving a request from the rightful owner.

