
Bitcoin is under pressure and struggling to recover from losses from earlier this week. Even with prices stabilising over the past day, the path of least resistance for now is south. For the trend to change, there needs to be a convincing close above the local resistance around $66,000.
Bitcoin active addresses are “anemic”
The data points to a worrying drop in on-chain activity as prices cool and consolidate within a bearish breakout formation. As for X, one analyst observe that in recent months, the number of active Bitcoin addresses has been declining. The only time this metric increased was from late 2023 to early 2024.
Coinciding with this expansion and looking at price data, Bitcoin prices had risen from under $30,000 to $73,800. Subsequently, and in reference to on-chain development, the number of active addresses has been plummeting.
Typically, a slowdown in network activity, as is the case right now, could have major consequences on price action. As evidenced by historical price movement, the number of active Bitcoin addresses increases in tandem when prices rise. Prices are under pressure and transfers from unique addresses have been falling, indicating lower interest from the masses.
Are Bitcoin ETFs to blame?
The analyst has picked a possible explanation for this contraction. If we look at the trend of active Bitcoin addresses, it is easy to notice that the activity lost momentum when the US Securities and Exchange Commission (SEC) approved the first batch of Bitcoin Spot ETF.
While the product allowed institutions to gain exposure to the world’s most valuable currency, there was a marked shift in ownership dynamics.
Unlike previous cycles, where prices reached new highs primarily due to retail activity and sentiment, now prices were in the hands of the “big guys” who could move millions at a time, moving prices.

Previously, it could take many “small” addresses to move prices, which explains why even when prices were depressed in the first half of 2023, activity was relatively higher than now.
If this is the trend, it is likely that as BTC pulls back, breaking key support levels, activity will further slow as institutions and retailers refrain from investing. The situation could get worse now that long-term holders have been moving coins in recent weeks.
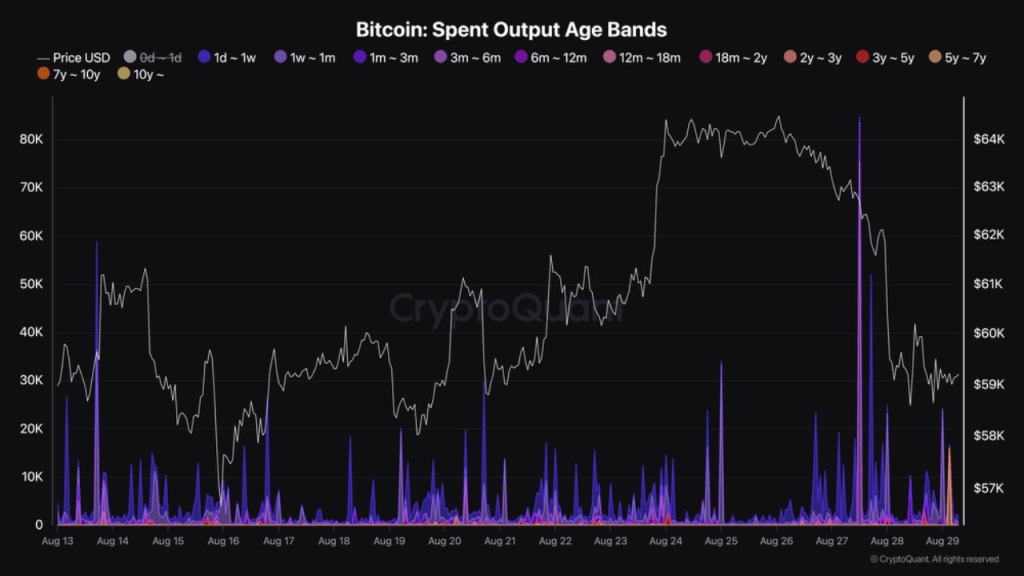
An analyst grades that 75,228 BTC aged between On August 27 alone, transfers were made between three and six months old. Yesterday, August 28, 1,614 BTC were transferred between 18 months and two years old.
Featured image from Canva, chart from TradingView
Disclaimer:
The information contained in this post is for general information purposes only. We make no representations or warranties of any kind, express or implied, about the completeness, accuracy, reliability, suitability or availability with respect to the website or the information, products, services, or related graphics contained on the post for any purpose.
We respect the intellectual property rights of content creators. If you are the owner of any material featured on our website and have concerns about its use, please contact us. We are committed to addressing any copyright issues promptly and will remove any material within 2 days of receiving a request from the rightful owner.