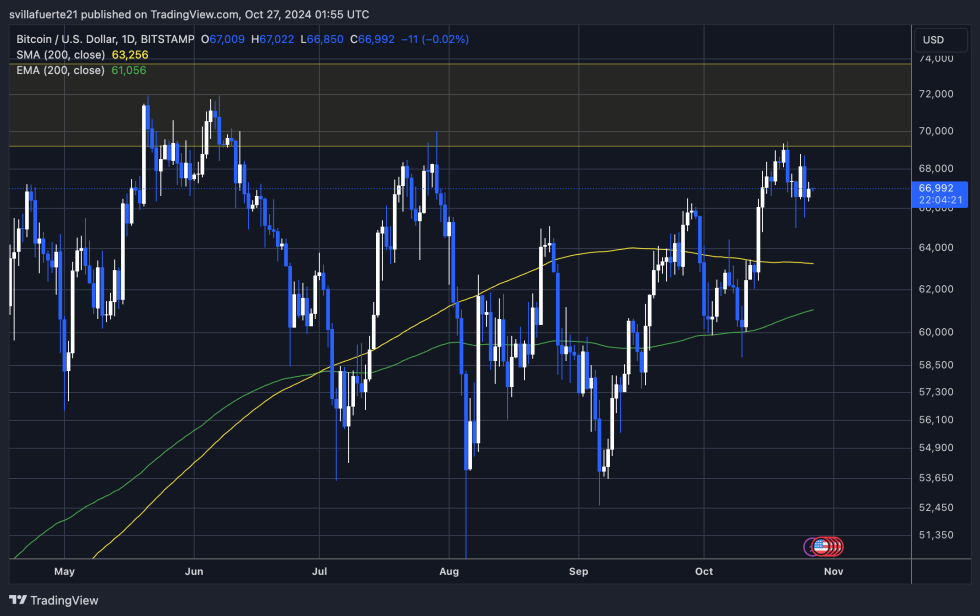
Bitcoin is currently trading at $66,800 after a week of significant volatility. The price has stabilized above the crucial support level of $65,000, indicating resilience as the market takes a breather after several weeks of high excitement. This consolidation phase below the key $70,000 mark suggests that BTC may be gearing up for its next big move.
Data from CryptoQuant reveals that Bitcoin demand remains strong, even amid cooling momentum. This strong demand is a positive indicator, suggesting that market participants are accumulating BTC at current levels, anticipating further upside potential. Analysts interpret this data as a sign that BTC is primed for an upward push once market conditions align.
The average trading volume in each 15-minute interval in the last 24 hours has been 60 BTC, marking a local high in the last two months. Such high trading volume highlights active participation and increased interest in the current price range, further supporting the possibility of a breakout.
As Bitcoin consolidates within this rangeThe $70,000 resistance level remains a critical threshold. If it exceeds it, it would probably attract more buyers and signal the beginning of a more sustained rebound. With these volume and demand indicators in play, BTC could soon ride this momentum to new highs.
Bitcoin Trading Volume Indicates Strong Demand
Bitcoin is showing resilience with a bullish outlook as spot trading volume reaches levels not seen in two months. Leading analyst and investor Axel Adler shared critical ideas aboutrevealing that the average trading volume per 15-minute interval over the past 24 hours was 60 BTC, marking a local high. This spike in trading activity points to solid demand, indicating strong interest in BTC even amid recent market challenges.
The increase in volume comes in the wake of Friday’s FUD (fear, uncertainty and doubt) surrounding USDT, which could have caused sell-offs or hesitation among retail investors. However, the increased trading volume suggests that mainstream investors, often referred to as “smart money,” are taking the opportunity to accumulate BTC at current levels. This accumulation phase is often a precursor to a broader price movement, as these high-volume buyers often look to position themselves ahead of significant price changes.
Analysts interpret this increase in volume as a sign that BTC is at a fundamental level, reinforcing bullish sentiment across the market. If trading volume remains high, it may fuel bullish momentum and support a breakout above resistance levels in the near term. The strong demand under current conditions suggests that BTC could be primed for its next rally, especially if it breaks key resistance levels like $70,000.
If volume maintains these elevated levels, Bitcoin could confirm bullish signals and move towards new highs, driven by a strategic accumulation base and renewed investor confidence.
BTC support remains strong
Bitcoin is currently stable above $66,000 after a period of volatility and uncertainty in the market. This level, a major liquidity area, served as a strong resistance point in late September and has now turned into support, indicating potential strength in the BTC trend. If Bitcoin manages to maintain its position above this crucial level, a push towards new all-time highs looks increasingly likely as buyer momentum builds and confidence returns to the market.

However, if BTC falls below the $65,000 mark, we could see the price enter a period of sideways consolidation as it searches for new liquidity. Such a consolidation phase would likely serve as a reset for the market, giving bulls and bears time to recalibrate. For the bullish structure to remain intact, BTC must remain above the 200-day moving average (MA), currently at $63,250. This MA level represents a fundamental threshold that market participants watch closely, as a drop below it could change sentiment and generate bearish pressure.
In the short term, maintaining strength above $66,000 could be the catalyst for a continued upward trajectory, which could push BTC to challenge key resistance levels on the way to new highs.
Featured image of Dall-E, TradingView chart
Disclaimer:
The information contained in this post is for general information purposes only. We make no representations or warranties of any kind, express or implied, about the completeness, accuracy, reliability, suitability or availability with respect to the website or the information, products, services, or related graphics contained on the post for any purpose.
We respect the intellectual property rights of content creators. If you are the owner of any material featured on our website and have concerns about its use, please contact us. We are committed to addressing any copyright issues promptly and will remove any material within 2 days of receiving a request from the rightful owner.

