In an analysis of the current dynamics of the Bitcoin market, prominent cryptocurrency analyst Dan Gambardello, in his latest article video In a message titled “Bitcoin Must Do This Now,” Gambardello addressed his 368,000 YouTube followers about the critical resistance levels that Bitcoin is currently testing. Gambardello emphasized the importance of these levels for both short-term price movements and broader market indicators.
Why Bitcoin Should Turn Bullish Now
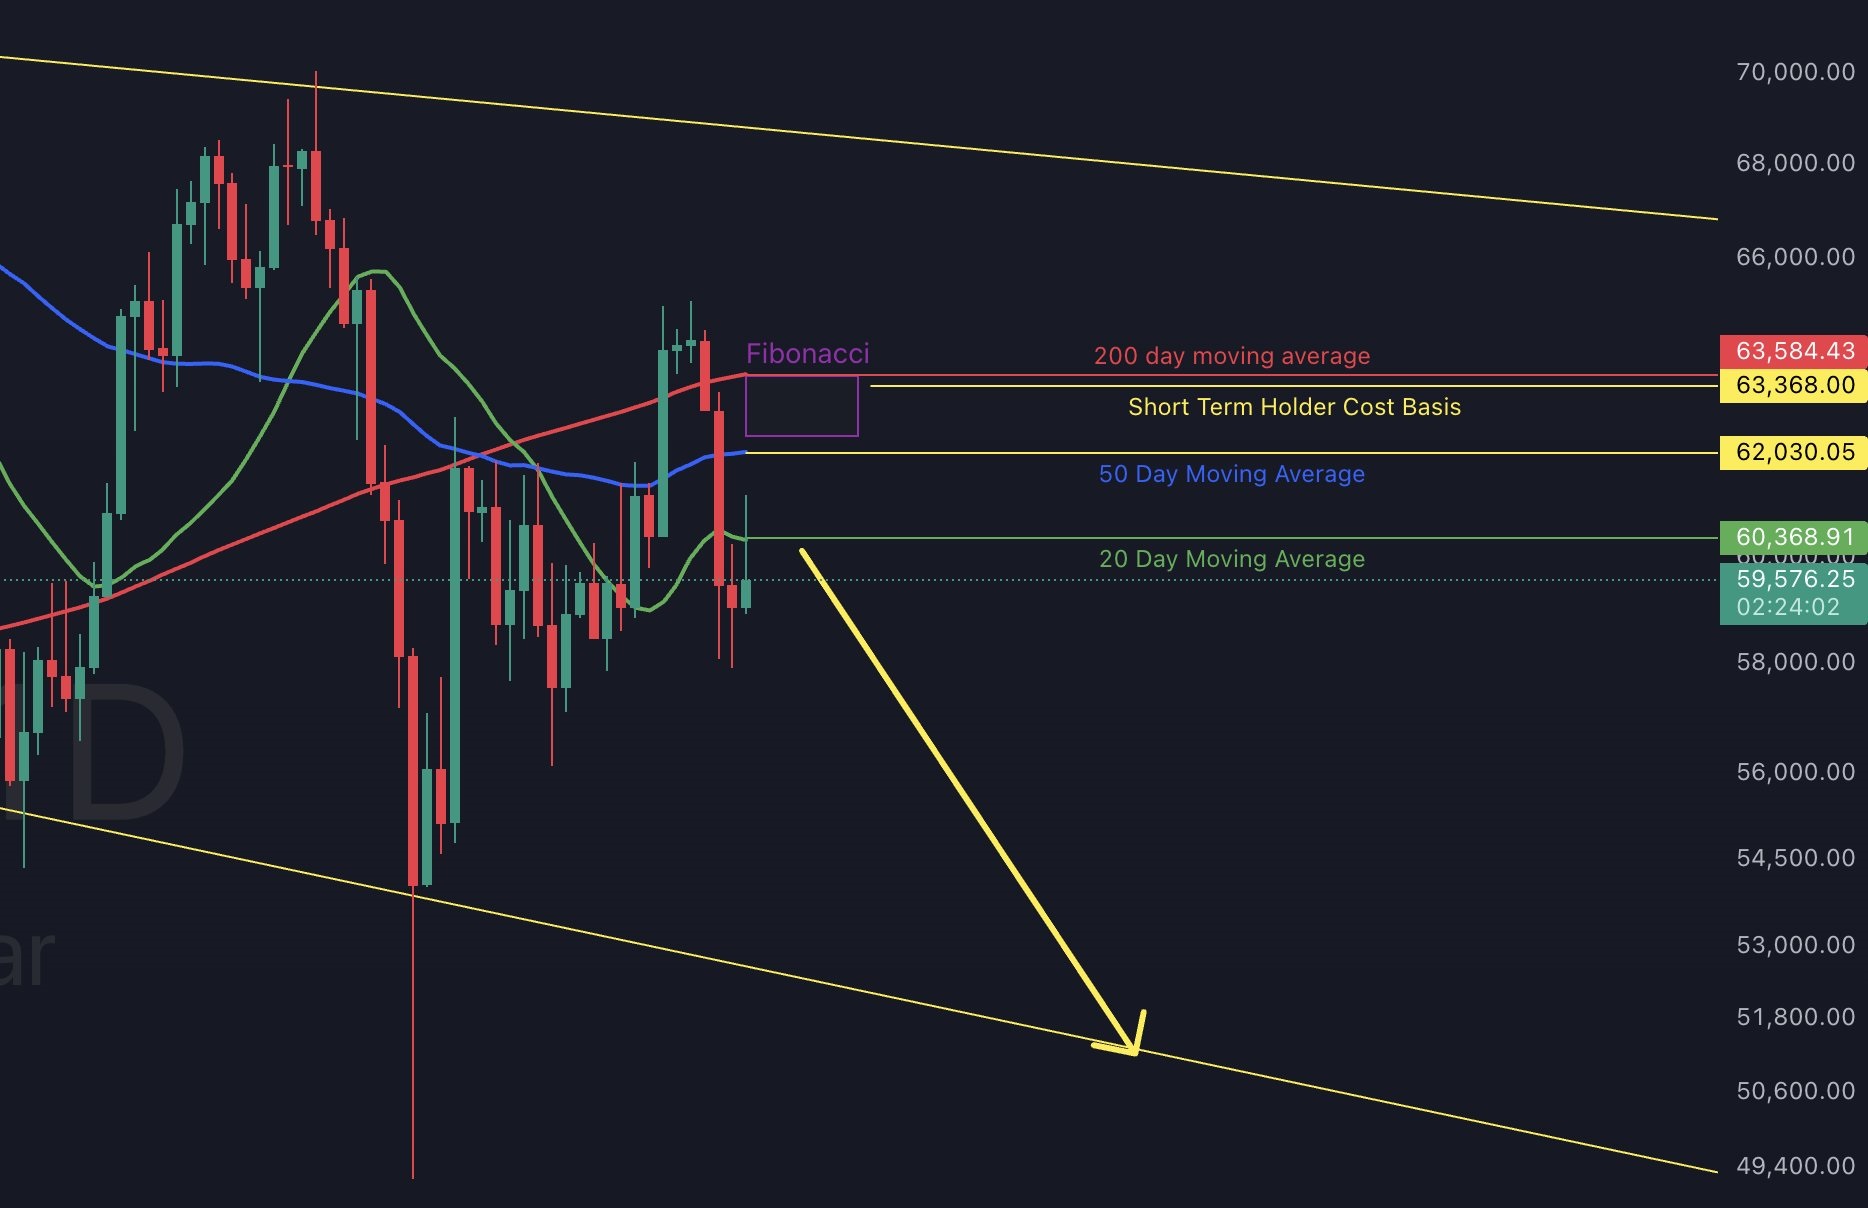
Gambardello’s analysis begins by emphasizing the importance of the short-term holder cost basis, which currently stands at $63,600. He highlighted this metric as a fundamental momentum indicator, underlining its role in determining the immediate bearish or bullish nature of the market. “Bitcoin is just $2,000 away from the short-term holder cost basis, which now stands at $63,600.” According to Gambardello, this is a fundamental momentum indicator that investors should keep in mind.
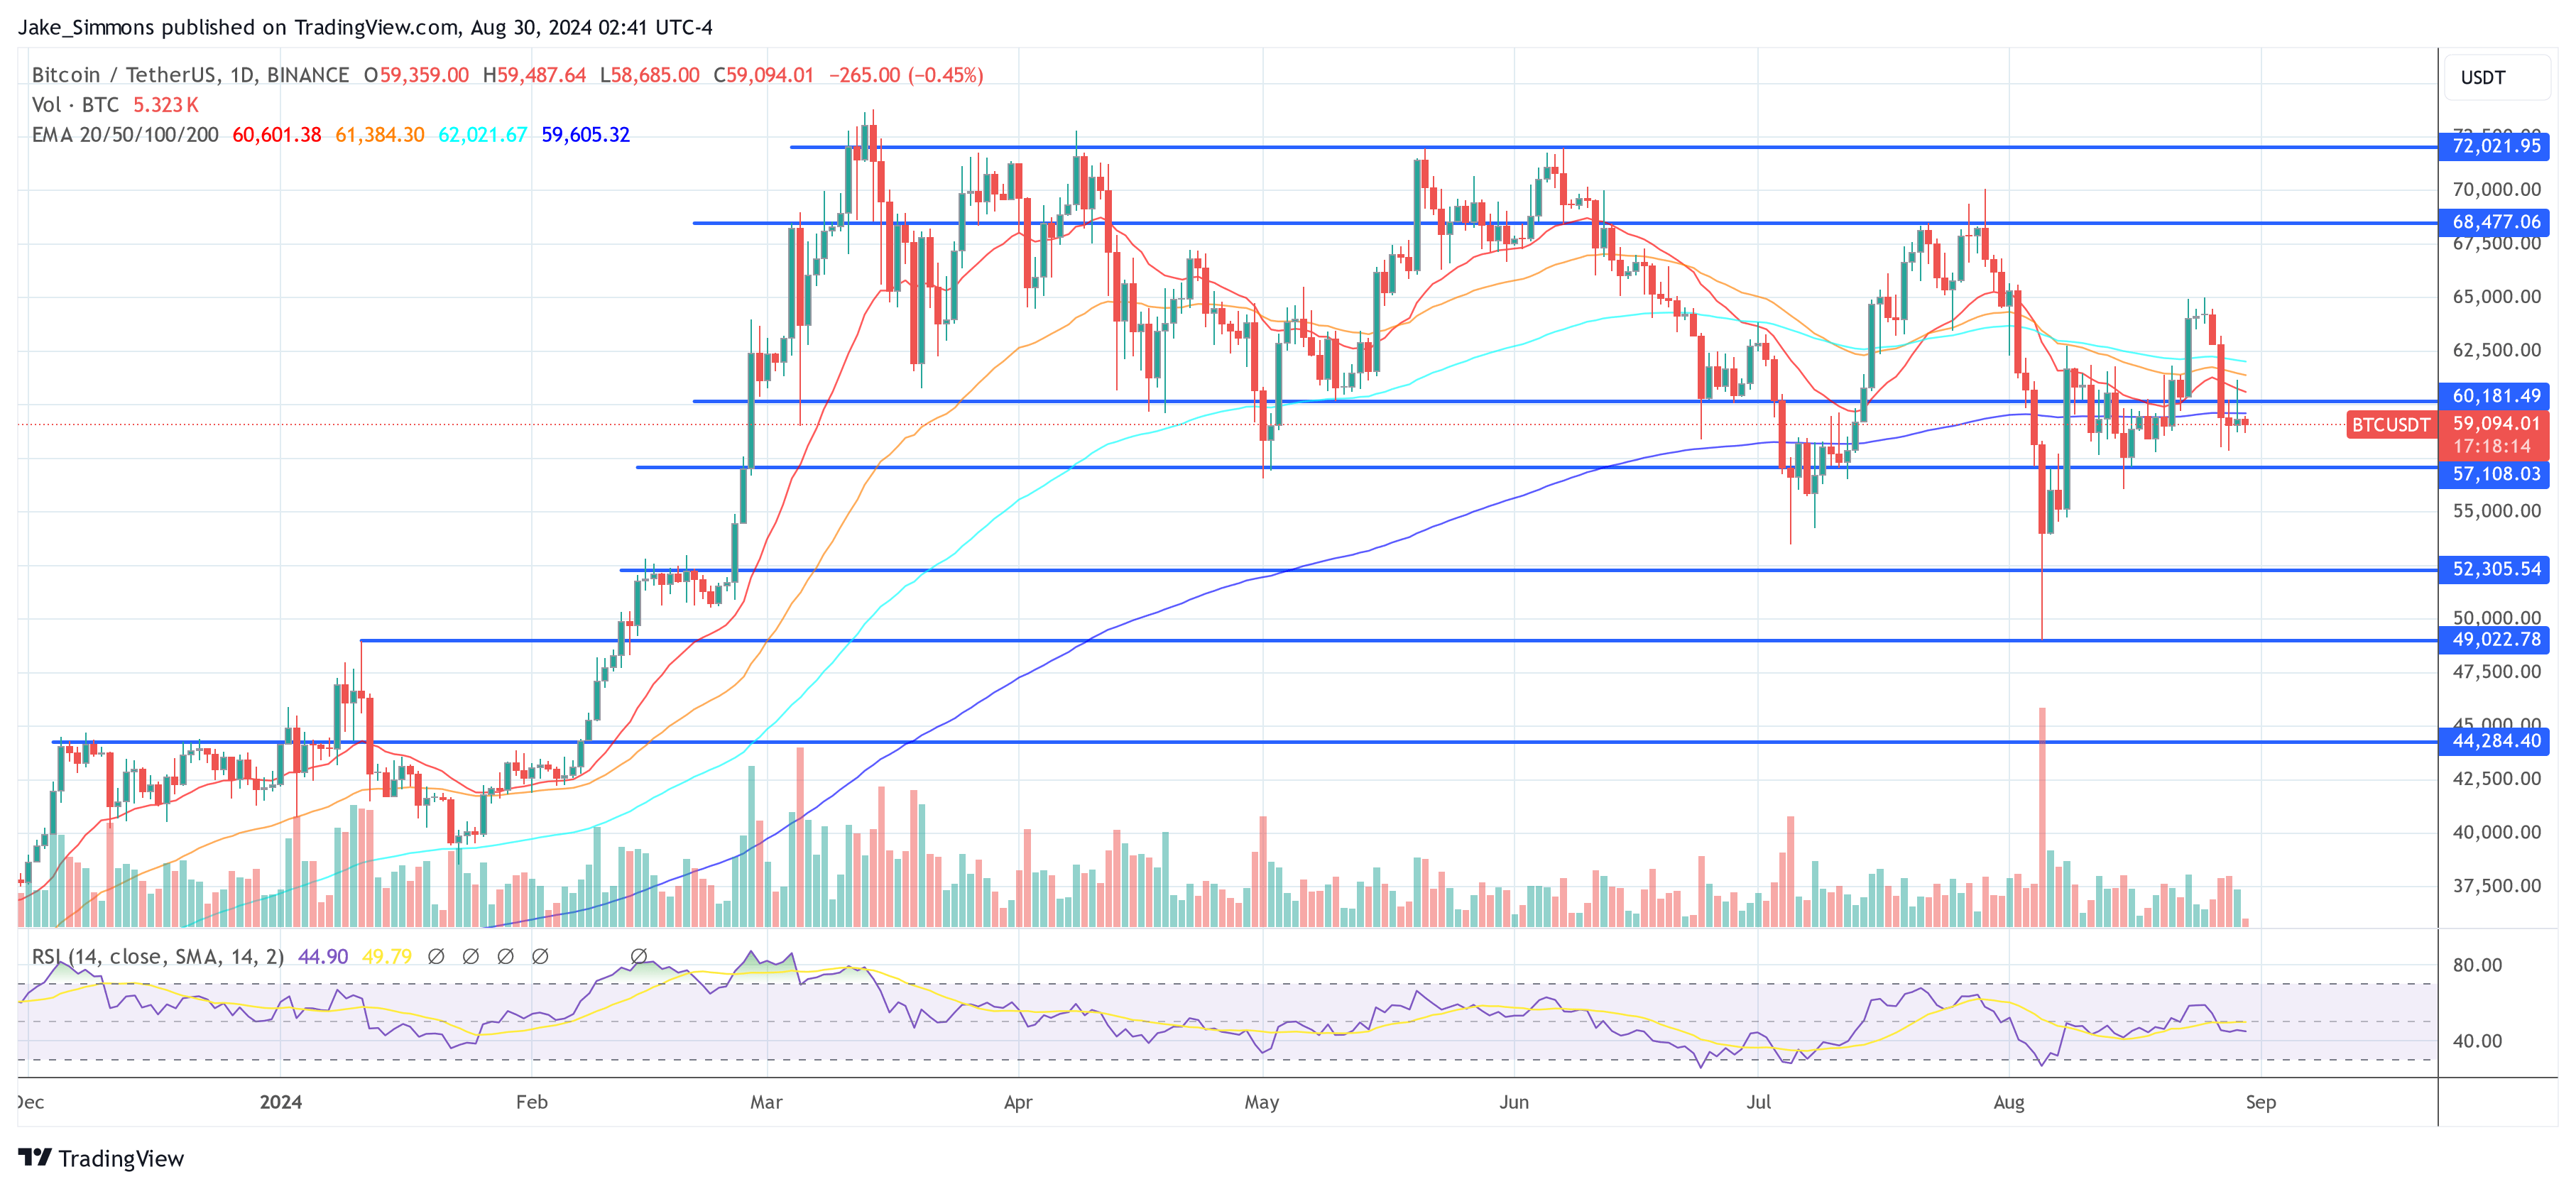
Gambardello also plots the various resistance zones that Bitcoin needs to conquer to signal a bullish trend change in the market. He notes that Bitcoin is trading just above the 20-day moving average on the daily chart at the time of his analysis. However, the proximity of the daily candle’s closing time left the situation very tentative. The 50-day and 200-day moving averages were also analyzed as important barriers that needed to be overcome to confirm a trend change. uptrend.
Related reading
In addition to these moving averages, Fibonacci retracement levels form another cornerstone of their technical analysis. It explains in detail the possibility of Bitcoin finding a lower high resistance zone, which could lead to price consolidation or a downward correction if these levels are not breached.
Gambardello also ventures into the macroeconomic field. He indicates that the prevalence of Recession-related fears It could signal broader economic changes that could affect the broader cryptocurrency market. “X’s algorithms are bombarding me with posts about recession, data about recession, charts about recession. There’s likely to be a surge because there are actually a lot of indicators that the market is going to crash,” he explained.
Additionally, the cryptocurrency analyst focuses heavily on the 20-week moving average, a level he describes as a historically significant marker for distinguishing between bull and bear markets. Failure to hold levels above this moving average, he notes, typically precedes downtrends, while support at or above this line could herald bullish conditions. “Failing to break above the 20-week moving average is what Bitcoin does when it enters bear markets,” he observes.
Related reading
From a momentum perspective, the analyst highlighted the Relative Strength Index (RSI) and Moving Average Convergence Divergence (MACD) indicators. Both tools, he mentions, currently suggest that Bitcoin is well positioned for a potential bullish move, given the consolidation patterns and cooling periods observed recently.
However, Bitcoin must move forward now. “Bitcoin really took off last cycle When the RSI was around 54 […] If we go back two cycles, Bitcoin was consistently around 53, 50 and close to 54 before taking off each time. […] “Consolidation on the RSI, then boom. So from a momentum perspective, we are right where we need to be. But the move we need now is up,” the cryptocurrency analyst warns.
Another warning sign could be a sustained drop below the 20-week moving average. “We need to see Bitcoin above that 20-week moving average. […] If we see resistance […] “We have to anticipate that we could get to the lower $50,000s very quickly. It could happen very quickly,” says Gambardello, pointing to this as an essential condition for the start of a sustained bullish phase.
From a bullish perspective, Gambardello expects a break above $63,700. “We are looking for bullish confirmations to break this whole range and it is actually currently at $63,000 or around $63,700; that is the range, it is not even a big range for Bitcoin to make the move, but that is what we are looking at,” he comments.
Overall, it’s a question of $50,000 or $70,000, as Gambardello says on X: “A break above could trigger a mini-run towards $70,000. A failure could mean new lows around $50,000.”
At the time of publication, BTC was trading at $
Featured image created with DALL.E, chart from TradingView.com
Disclaimer:
The information contained in this post is for general information purposes only. We make no representations or warranties of any kind, express or implied, about the completeness, accuracy, reliability, suitability or availability with respect to the website or the information, products, services, or related graphics contained on the post for any purpose.
We respect the intellectual property rights of content creators. If you are the owner of any material featured on our website and have concerns about its use, please contact us. We are committed to addressing any copyright issues promptly and will remove any material within 2 days of receiving a request from the rightful owner.