
Despite seeing multiple drops in recent months, expectations for the price of Bitcoin (BTC) remain incredibly high after a Increase in inflows into exchange-traded funds (ETFs)At the head of this forecast is cryptocurrency analyst Micky Bull, who has revealed another bullish prediction, putting The price of BTC above the coveted $100,000 mark.
Positive Bitcoin ETF inflow will trigger Bitcoin price surge
US spot Bitcoin ETFs saw positive inflows of $39.02 million on September 12, 2024, marking a turnaround from previous low volumes. In contrast, Ethereum ETFs saw a net outflow of $20.14 million, with some ETFs seeing no change.
Typically, positive inflows occur when the cost basis for ETF investors (the original value of BTC for tax purposes) exceeds the current price of Bitcoin. According to CryptoQuant CEO Ki Young Ju, cost basis The retail price of the “New Custodial Wallets/ETFs” is $62,000, while Bitcoin is trading at around $57,000, implying that most ETF investors are currently in the red.
The convergence of rising ETF inflows, institutional accumulation, and historical patterns has led analysts to agree that Bitcoin (BTC) is on the verge of a significant rally.
Miky Bull, for example, has raised his Bitcoin target price at $112,000, expressing confidence in the cryptocurrency’s potential to surpass previous highs. According to his post on X, BTC could be poised for a parabolic rally, reaching a cycle peak in the coming months. His analysis is based solely on historical trends following previous Bitcoin halvings.
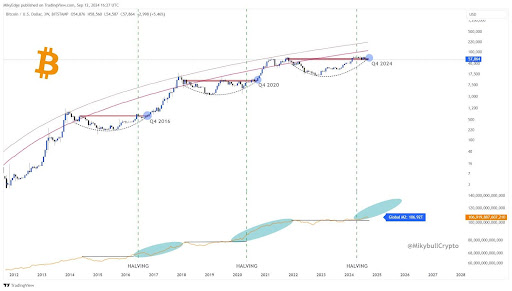
As he stated: “History has prevailed. In Q4 of 2016 and 2020, post-halving, we witnessed the start of a parabolic rally towards a cycle high. Bitcoin is heading for a first target of $112,000 this year.” Therefore, it is speculated that the recent surge in ETF inflows could serve as a catalyst, influencing investment and adoption.
BTC will reach the $65,000 mark first
Bitcoin’s recent price action has formed an intriguing Graphic pattern This, if completed, could signal a bullish reversal and propel Bitcoin towards $65,000. An inverted head and shoulders (H&S) pattern is emerging, suggesting a potential price target of around $65,000. However, this requires a break above the current consolidation zone ($62,000), which could trigger another search for liquidity on the sell side.

A break above the H&S neckline, found at $59,500, could initiate a surge towards the top of the range, potentially reaching $65,000 on a second run at buy-side liquidity before pulling back. However, a break above $65,000 with confirmed volume could lead to a more significant rally, potentially surpassing the previous all-time high to reach the $112,000 mark predicted by analyst Mikky Bull.

Featured image created with Dall.E, chart from Tradingview.com
Disclaimer:
The information contained in this post is for general information purposes only. We make no representations or warranties of any kind, express or implied, about the completeness, accuracy, reliability, suitability or availability with respect to the website or the information, products, services, or related graphics contained on the post for any purpose.
We respect the intellectual property rights of content creators. If you are the owner of any material featured on our website and have concerns about its use, please contact us. We are committed to addressing any copyright issues promptly and will remove any material within 2 days of receiving a request from the rightful owner.