
BNB price started a new surge and surpassed the $500 Pivot Zone. The price is now consolidating gains and could target further gains above $525.
- BNB price started a fresh surge above the $500 resistance zone.
- The price is now trading below $510 and the 100 hourly simple moving average.
- There was a break below a key bullish trend line with support at $517 on the hourly chart of the BNB/USD pair (data feed from Binance).
- The pair needs to stay above the $500 pivot level to start another increase in the near term.
BNB price is above $500
After forming a base above the $470 level, BNB price started a fresh increase as Ethereum and BitcoinThe price managed to break through the resistance levels of $488 and $500.
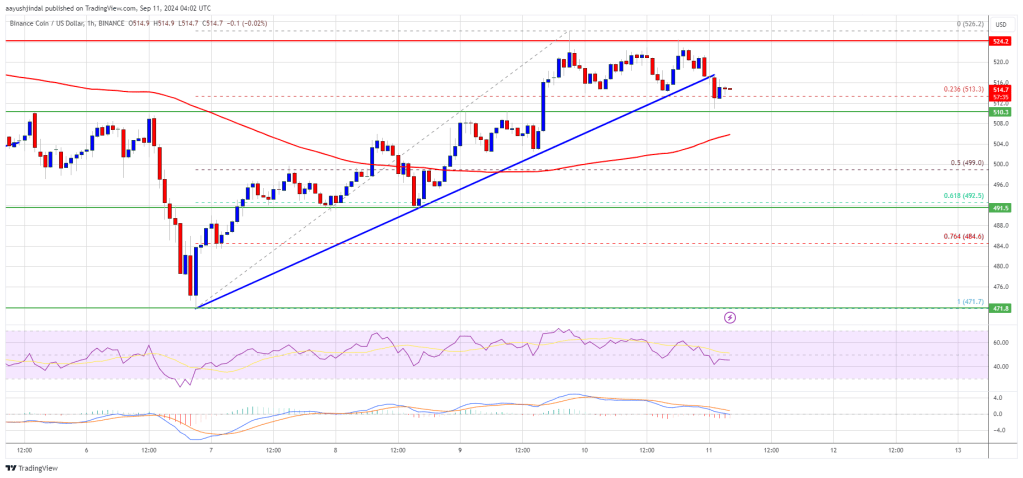
It even surpassed the $515 level and tested $525. A high was formed at $526 and the price started a downside correction. There was a move below the $520 level. The price fell just below the 23.6% Fibonacci retracement level of the upward move from the low of $471 to the high of $526.
Moreover, there was a break below a key bullish trend line with support at $517 on the hourly chart of the BNB/USD pair. The pair is now trading above $510 and the 100 hourly simple moving average.
If a further increase occurs, the price might face resistance near the $518 level. The next resistance lies near the $525 level. A clear move above the $525 zone could push the price higher. In the stated case, BNB price might test $535.
A close above the $535 resistance could set the pace for a broader move towards the $550 resistance. Any further gains could require a test of the $562 level in the near term.
Another decline?
If BNB fails to clear the $525 resistance, it could start another decline. The initial support on the downside is near the $510 level. The next major support is near the $500 level.
The main support lies at $492. If there is a downside break below the $492 support, the price could drop towards the $470 support. Any further losses could initiate a larger decline towards the $450 level.
Technical indicators
Hourly MACD – The MACD for BNB/USD is losing momentum in the bullish zone.
Hourly RSI (Relative Strength Index) – The RSI for BNB/USD is currently above the 50 level.
Major Support Levels: $510 and $500.
Major Resistance Levels: $518 and $525.
Disclaimer:
The information contained in this post is for general information purposes only. We make no representations or warranties of any kind, express or implied, about the completeness, accuracy, reliability, suitability or availability with respect to the website or the information, products, services, or related graphics contained on the post for any purpose.
We respect the intellectual property rights of content creators. If you are the owner of any material featured on our website and have concerns about its use, please contact us. We are committed to addressing any copyright issues promptly and will remove any material within 2 days of receiving a request from the rightful owner.